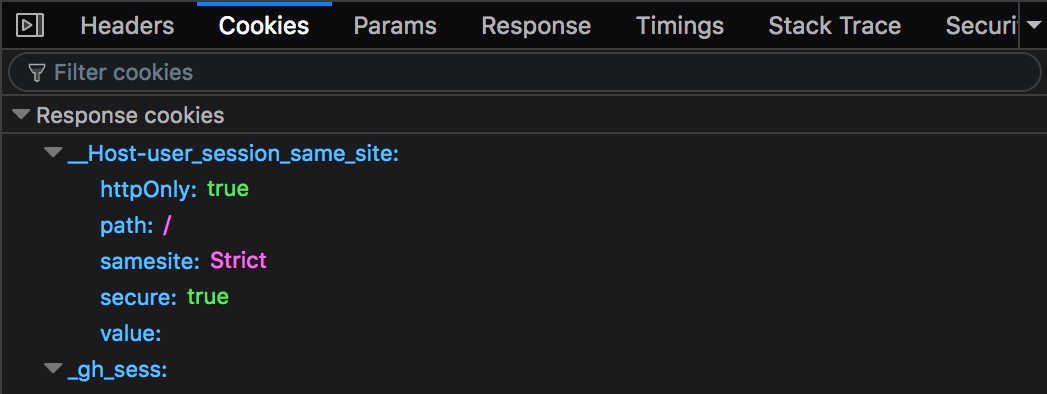
Network request details
The request details pane appears when you click on a network request in the request list. This pane provides more detailed information about the request.
Network request details
Clicking on a row displays a new pane in the right-hand side of the network monitor, which provides more detailed information about the request.
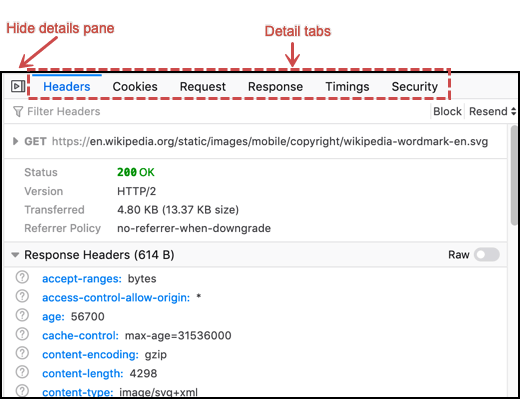
The tabs at the top of this pane enable you to switch between the following pages:
Messages (only for WebSocket items)
Stack trace (only when the request has a stack trace, e.g. a script called by another script).
Clicking the icon at the right-hand end of the toolbar closes the details pane and returns you to the list view.
Headers tab
The Headers tab has a toolbar, followed by three main sections.
This includes:
Information about the request
Status: The response status code for the request; click the “?” icon to go to the reference page for the status code.
Version: The version of HTTP used.
Transferred: The amount of data transferred for the request.
Referrer policy: The value of the Referrer-policy header.
HTTP Early hints response headers (when the request includes early hints)
HTTP Response headers
HTTP Request headers
Each section has a disclosure triangle to expand the section to show more information.
Headers toolbar
Using the Headers toolbar, you can:
Filter the headers in the Response Headers and Request Headers sections.
Block the domain involved in this request. The domain is added to the Blocking sidebar.
Resend the request. The Resend button opens a menu with two items:
Resend: Resends the request.
Edit and Resend: Enables an editing mode, where you can modify the method, URL, request headers, or request body of the request. Click Send to send the modified request, or Cancel to cancel editing.
Request Information
The following information is shown only when the section is expanded:
Scheme: The scheme used in the URL
Host: The server involved in the request
Filename: The full path to the file requested
Address: The IP address of the host
The following information is shown in both the collapsed and the expanded states:
Status: The HTTP response code for the request.
Version: The HTTP version used
Transferred: The amount of data transferred with the request
The Referrer Policy, which governs which referrer information, sent in the Referer header, should be included with requests. (See Referrer-Policy for a description of possible values)
Blocking: If the request is to a site that is associated with a known tracker, an icon and a message are shown; otherwise, this field is not shown.
Early hints response headers
The Early hints response headers section shows the headers provided by HTTP 103 informational response. For each line in the early hints response headers section, a question mark links to the documentation for that response header, if one is available.
A Raw toggle button in the section heading controls whether the headers are shown with formatting, or as plain, unformatted text.

Response headers
The response headers section shows details about the response. For each line in the response headers section, a question mark links to the documentation for that response header, if one is available.
A Raw toggle button in the section heading controls whether the headers are shown with formatting, or as plain, unformatted text.
Note
Note that the keys in the response header are all in lowercase, while the request headers keys are not. HTTP/2 requires that all headers be lowercase; response headers are shown as they are received from the server. (There may be some exceptions, such as X-Firefox-Spdy, which is added by Firefox.)
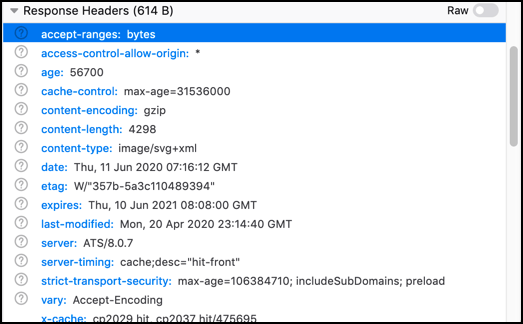
You can copy some or all of the response header in JSON format by using the context menu:

If you select Copy, a single key word, value pair is copied. If you select Copy All, the entire header is copied in JSON format, giving you something like this (after running the results through a JSON validator):
{
  "Response headers (1.113 KB)": {
    "headers": [
      {
        "name": "accept-ranges",
        "value": "bytes"
      },
      {
        "name": "age",
        "value": "0"
      },
      {
        "name": "backend-timing",
        "value": "D=74716 t=1560258099074460"
      },
      {
        "name": "cache-control",
        "value": "private, must-revalidate, max-age=0"
      },
      {
        "name": "content-disposition",
        "value": "inline; filename=api-result.js"
      },
      {
        "name": "content-encoding",
        "value": "gzip"
      },
      {
        "name": "content-length",
        "value": "673"
      },
      {
        "name": "content-type",
        "value": "text/javascript; charset=utf-8"
      },
      {
        "name": "date",
        "value": "Tue, 11 Jun 2019 13:01:39 GMT"
      },
      {
        "name": "mediawiki-login-suppressed",
        "value": "true"
      },
      {
        "name": "p3p",
        "value": "CP=\"This is not a P3P policy! See https://en.wikipedia.org/wiki/Special:CentralAutoLogin/P3P for more info.\""
      },
      {
        "name": "server",
        "value": "mw1316.eqiad.wmnet"
      },
      {
        "name": "server-timing",
        "value": "cache;desc=\"pass\""
      },
      {
        "name": "strict-transport-security",
        "value": "max-age=106384710; includeSubDomains; preload"
      },
      {
        "name": "vary",
        "value": "Accept-Encoding,Treat-as-Untrusted,X-Forwarded-Proto,Cookie,Authorization,X-Seven"
      },
      {
        "name": "via",
        "value": "1.1 varnish (Varnish/5.1), 1.1 varnish (Varnish/5.1)"
      },
      {
        "name": "x-analytics",
        "value": "ns=-1;special=Badtitle;WMF-Last-Access=11-Jun-2019;WMF-Last-Access-Global=11-Jun-2019;https=1"
      },
      {
        "name": "x-cache",
        "value": "cp1075 pass, cp1075 pass"
      },
      {
        "name": "x-cache-status",
        "value": "pass"
      },
      {
        "name": "x-client-ip",
        "value": "204.210.158.136"
      },
      {
        "name": "x-content-type-options",
        "value": "nosniff"
      },
      {
        "name": "X-Firefox-Spdy",
        "value": "h2"
      },
      {
        "name": "x-frame-options",
        "value": "SAMEORIGIN"
      },
      {
        "name": "x-powered-by",
        "value": "HHVM/3.18.6-dev"
      },
      {
        "name": "x-search-id",
        "value": "esvan0r5bnnwscyk2wq09i1im"
      },
      {
        "name": "x-varnish",
        "value": "766019457, 417549316"
      }
    ]
  },
  "Request headers (665 B)": {
    "headers": [
      {
        "name": "Accept",
        "value": "*/*"
      },
      {
        "name": "Accept-Encoding",
        "value": "gzip, deflate, br"
      },
      {
        "name": "Accept-Language",
        "value": "en-US,en;q=0.5"
      },
      {
        "name": "Connection",
        "value": "keep-alive"
      },
      {
        "name": "Cookie",
        "value": "WMF-Last-Access=11-Jun-2019; WMF-Last-Access-Global=11-Jun-2019; mwPhp7Seed=5c9; GeoIP=US:NY:Port_Jervis:41.38:-74.67:v4"
      },
      {
        "name": "DNT",
        "value": "1"
      },
      {
        "name": "Host",
        "value": "en.wikipedia.org"
      },
      {
        "name": "Referer",
        "value": "https://www.wikipedia.org/"
      },
      {
        "name": "TE",
        "value": "Trailers"
      },
      {
        "name": "User-Agent",
        "value": "Mozilla/5.0 (Windows NT 10.0; Win64; x64; rv:68.0) Gecko/20100101 Firefox/68.0"
      }
    ]
  }
}
Request headers
The Request headers section shows details about the request headers. For each line in the request headers section, a question mark links to the documentation for that request header, if one is available.
A Raw toggle button in the section heading controls whether the headers are shown with formatting, or as plain, unformatted text.

Request tab
Request shows the complete request parameters, by default, in a formatted view:

Switch the toggle button to have the raw view presented:

Response tab
The complete content of the response. If the response is HTML, JS, or CSS, it will be shown as text:

The toggle button for switching between raw and formatted response view has been implemented (bug 1693147). The previous HTML example makes use of the formatted view. When the toggle button is turned on, the raw response view will be enabled:

If the response is JSON, it will be shown as an inspectable object:

In the raw response view the response will be shown as a string:

If the response is an image, the tab displays a preview:
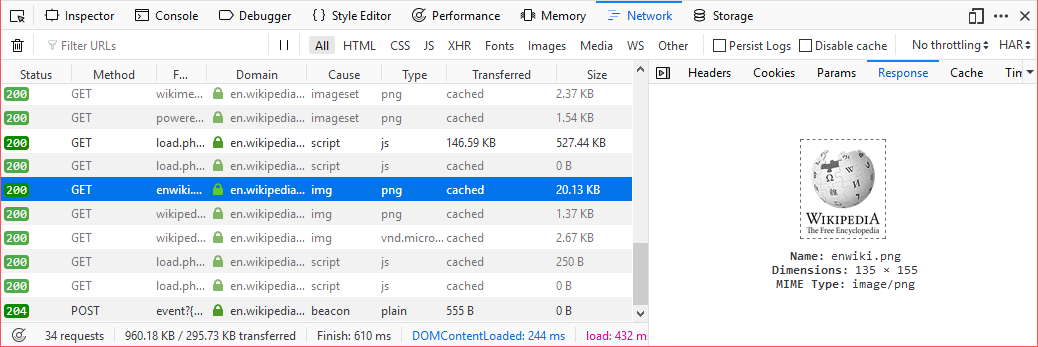
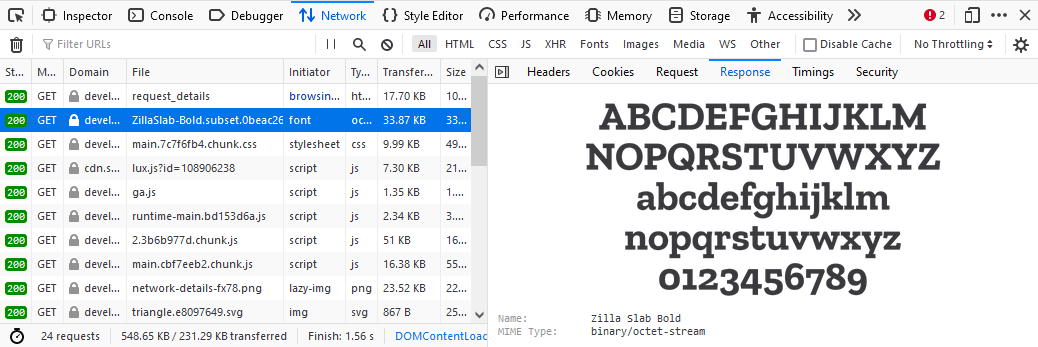
If the response is a web font, the tab also displays a preview:
For network responses that are initiated by a WebSocket connection, the details pane shows any associated messages. For more information, see Inspecting web sockets.
Cache tab
If the response is cached (i.e. a 304), the Cache tab displays details about that cached resource.
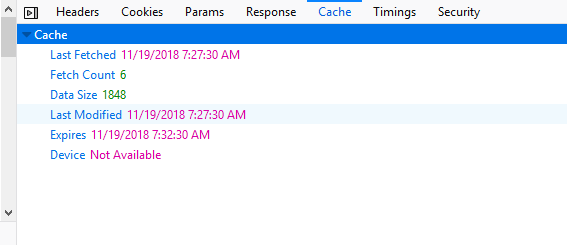
These details include:
Last fetched: The date the resource was last fetched
Fetched count: The number of times in the current session that the resource has been fetched
Data size: The size of the resource.
Last modified: The date the resource was last modified.
Expires: The date the resource expires.
Device: The device the resource was fetched from (e.g. “disk”).
HTML preview
If the response is HTML, a preview of the rendered HTML appears inside the Response tab, above the response payload.
Timings tab
The Timings tab provides information about how long each stage of a network request took, with a more detailed, annotated, view of the timeline bar, so it is easy to locate performance bottlenecks.
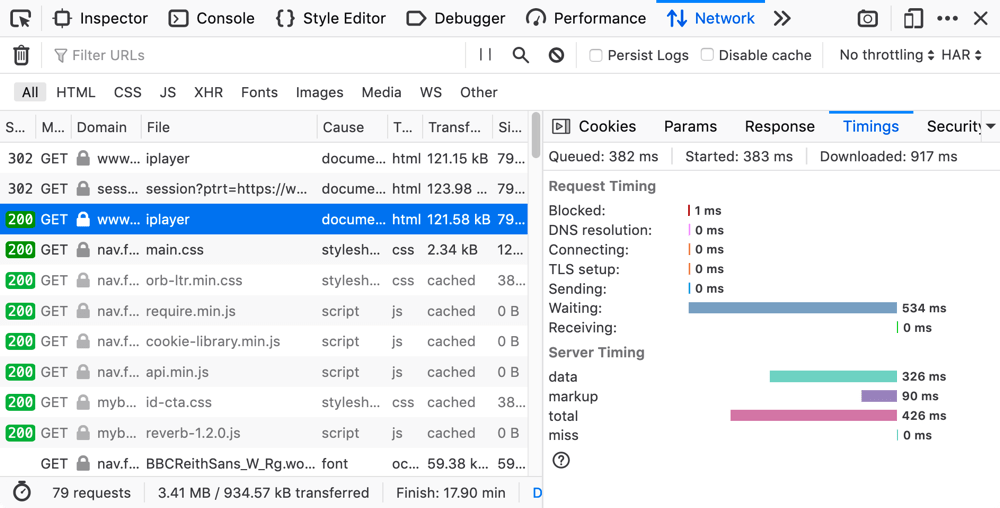
This tab can include the following sections.
Queued, Started, Downloaded
The following timings are displayed at the top of the Timings tab:
Queued: When the resource was queued for download.
Started: When the resource started downloading.
Downloaded: When the resource finished downloading.
Note
Future versions will also show this information when entries in the network monitor timeline graph are moused over (see bug 1580493).
Request Timing
The Request Timing section breaks a network request down into the following subset of the stages defined in the HTTP Archive specification:
Name |
Description |
Blocked |
Time spent in a queue waiting for a network connection. The browser imposes a limit on the number of simultaneous connections that can be made to a single server. In Firefox this defaults to 6, but can be changed using the network.http.max-persistent-connections-per-server preference. If all connections are in use, the browser can’t download more resources until a connection is released. |
DNS resolution |
Time taken to resolve a host name. |
Connecting |
Time taken to create a TCP connection. |
Sending |
Time taken to send the HTTP request to the server. |
Waiting |
Waiting for a response from the server. |
Receiving |
Time taken to read the entire response from the server (or cache). |
Server Timing
The Server Timing section lists any information provided in the Server-Timing header — this is used to surface any backend server timing metrics you’ve recorded (e.g. database read/write, CPU time, file system access, etc.).
The header takes a series of descriptions and durations, which can be anything you like. In the above screenshot for example, the highlighted request’s Server-Timing header contains 4 items — data, markup, total, and miss.
Service Worker Timing
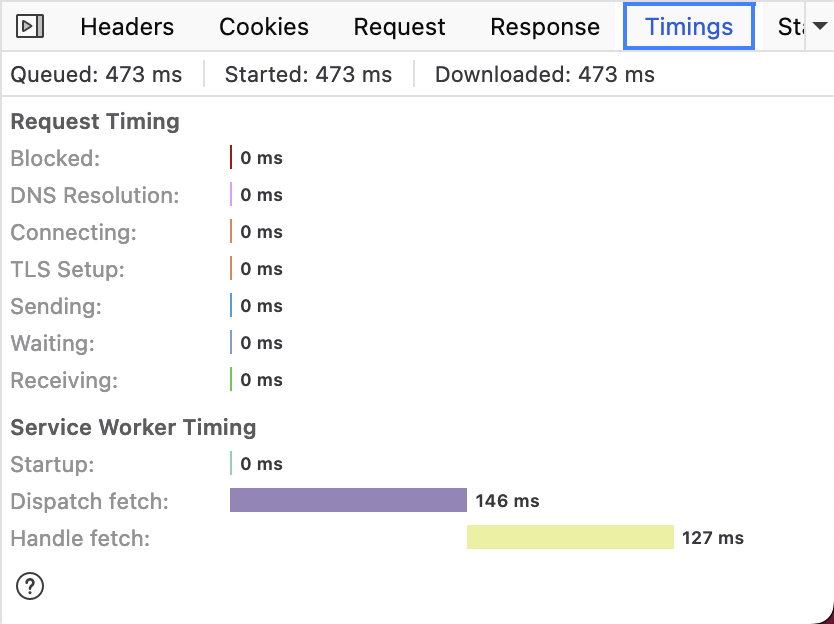
The Service Worker Timing section lists the information relating to the specific service worker request. The metrics include Startup, Dispatch fetch and Handle fetch.
Name |
Description |
Startup |
Time taken to launch the service worker, this is only indicated if the launch starts after the fetch event has already been dispatched. |
Dispatch fetch |
Time taken from when a fetch event is triggered to just before it starts getting handled by the service worker. |
Handle fetch |
Time taken to by the service worker to handle the fetch event. |
Security tab
If the site is being served over HTTPS, you get an extra tab labeled “Security”. This contains details about the secure connection used including the protocol, the cipher suite, and certificate details:

The Security tab shows a warning for security weaknesses. Currently it warns you about two weaknesses:
Using SSLv3 instead of TLS
Using the RC4 cipher

Stack trace tab
Stack traces are shown in the Stack Trace tab, for responses that have a stack trace of course.

Network Monitor Features
The following articles cover different aspects of using the network monitor:

