Rich output
When the Web console prints objects, it includes a richer set of information than just the object’s name. In particular, it:
Type-specific rich output
The Web Console provides rich output for many object types, including the following:
|

|
|

|
|

|
|

|
|

|
|

|
|

|
|

|
Examining object properties
When an object is logged to the console it has a right-pointing triangle next to it, indicating that it can be expanded. Click on the triangle, and the object will be expanded to show its contents:

You can use the arrow keys on your keyboard to navigate through objects displayed in the console. The right-arrow key opens the details of an object and the left-arrow key closes open objects.
Examining request details
Similar to examining object details, you can see the details about a network request directly in the console. Click on the arrow next to the request and a details panel will open that is equivalent to the Headers panel in the Network Monitor tool.
Export output to the clipboard
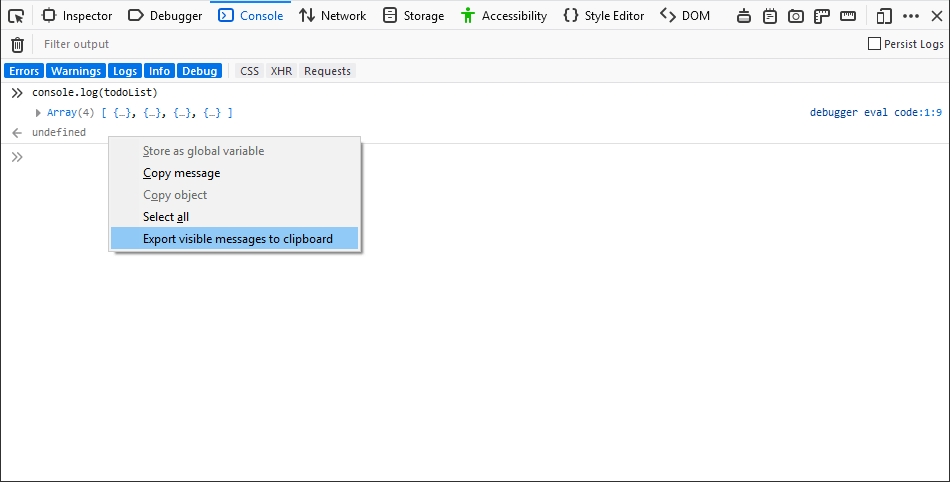
Once you have output in the console window, you can save it to the clipboard by right-clicking on the output and selecting Export visible messages to clipboard:

This will copy all of the output to the clipboard. Then you can paste it into a document. The output will look something like this:
console.log(todoList)
Array(4) [ {…}, {…}, {…}, {…} ]
debugger eval code:1:9
undefined
If you expand objects, such as arrays, you get slightly different content. For example, by expanding the array in the above list, I get the following:
console.log(todoList)
(4) […]

0: Object { status: "Done", description: "Morning Pages", dateCreated: 1552404478137 }

1: Object { status: "In Progress", description: "Refactor styles", dateCreated: 1552404493169 }

2: Object { status: "To Do", description: "Create feedback form", dateCreated: 1552404512630 }

3: Object { status: "To Do", description: "Normalize table", dateCreated: 1552404533790 }

length: 4

<prototype>: Array []
debugger eval code:1:9
undefined
Highlighting and inspecting DOM nodes
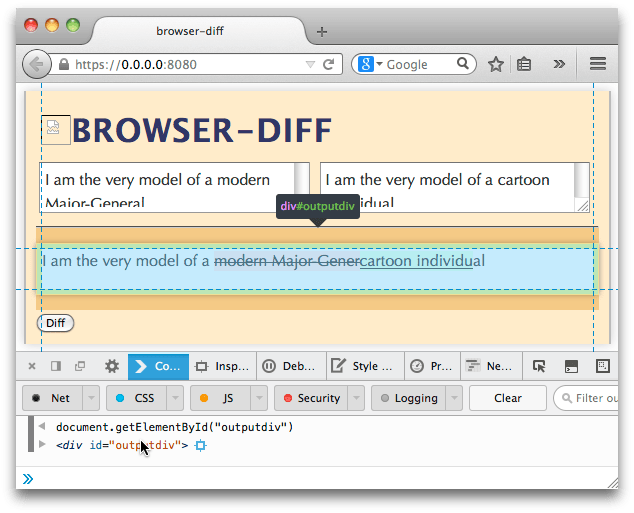
If you hover the mouse over any DOM element in the console output, it’s highlighted on the page:

In the screenshot above you’ll also see a blue “target” icon next to the node in the console output: click it to switch to the Inspector with that node selected.