JIT Profiling with perf
Maybe preferable: profiling with samply
samply makes profiling JIT a lot easier and should be preferred if running
macOS or Linux. Documentation is at JIT profiling with
samply.
Introduction
perf is a performance profiling tool available on Linux that is
capable of measuring performance events such as cycles, instructions executed,
cache misses, etc and providing assembly and source code annotation. It is
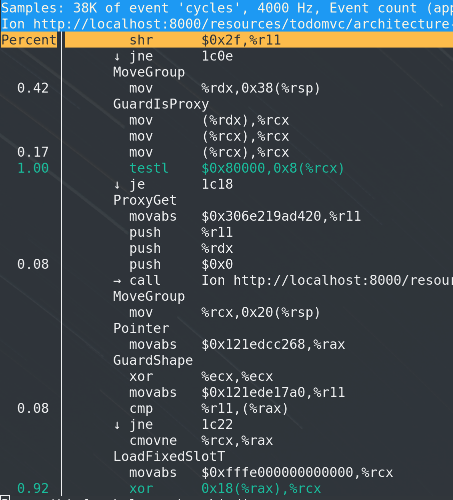
possible to collect performance profiles of the SpiderMonkey JIT using perf on
Linux and also annotate the generated assembly with the IR opcodes that were
used during compilation as shown below.
Build setup
JIT profiling with perf jitdump is enabled by default for nightly builds in the shell and browser.
If you wish to disable jitdump support in your build, then you can include the following build flag:
ac_add_options --disable-jitdump
Environment Variables
Environment variables that must be defined for perf JIT profiling:
PERF_SPEW_DIR: Location of jitdump output files. Making this directory a tmpfs filesystem could help reduce overhead.
IONPERF: Valid options include: func, src, ir, ir-ops.
IONPERF=func will disable all annotation and only function names will be available. It is the fastest option.
IONPERF=ir will enable IR annotation.
IONPERF=ir-ops will enable IR annotation with operand support. Requires –enable-jitspew and adds additional overhead to “ir”.
IONPERF=ir-graph will output the full IR for interactive visualization. Requires –enable-jitspew and adds additional overhead to “ir”.
IONPERF=src will enable source code annotation only if perf can read the source file locally. Only really works well in the JS shell.
Profiling the JS shell
Profiling the JS shell requires the following commands but is very straight forward.
Begin by removing any pre-existing jitdump files:
rm -rf output or rm -f jitted-*.so jit.data perf.data jit-*.dump jitdump-*.txt
Next define environment variables:
export IONPERF=ir
export PERF_SPEW_DIR=output
Run your test case with perf attached:
perf record -g -k 1 /home/denis/src/mozilla-central/obj-js/dist/bin/js test.js
Inject the jitdump files into your perf.data file:
perf inject -j -i perf.data -o jit.data
View the profile:
perf report --no-children --call-graph=graph,0 -i jit.data
All of the above commands can be put into a single shell script.
Profiling the Browser
Profiling the browser is less straight forward than the shell, but the only main difference is that perf must attach to the content process while it is running.
Begin by removing any pre-existing jitdump files:
rm -rf output or rm -f jitted-*.so jit.data perf.data jit-*.dump jitdump-*.txt
Next define environment variables:
export IONPERF=ir
export PERF_SPEW_DIR=output
export MOZ_DISABLE_CONTENT_SANDBOX=1
Run the Firefox browser
~/mozilla-central/obj-opt64/dist/bin/firefox -profile ~/mozilla-central/obj-opt64/tmp/profile-default &
Navigate to the test case, but do not start it yet. Then hover over the tab to get the content process PID.
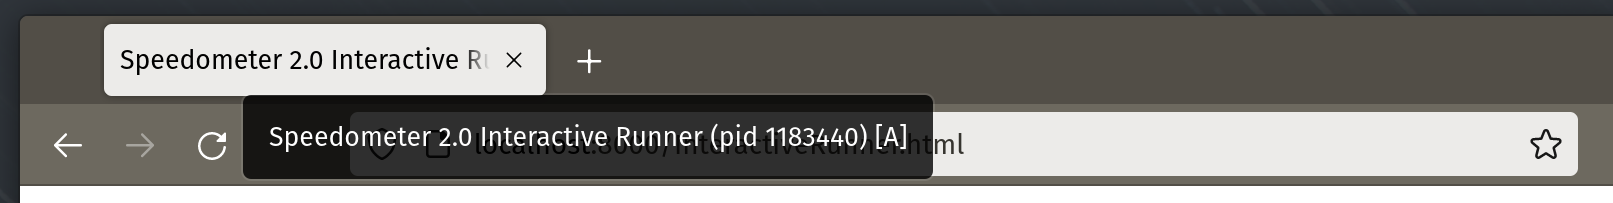
Attach perf to begin profiling:
perf record -g -k 1 -p <pid>
Close the browser when finished benchmarking.
Inject the jitdump files into your perf.data file:
perf inject -j -i perf.data -o jit.data
View the profile (–call-graph=graph,0 shows all call stacks instead of the default threshold of >= 0.5%):
perf report --no-children --call-graph=graph,0 -i jit.data
Additional Information
Some Linux distributions offer a “libc6-prof” package that includes frame pointers. This can help resolve symbols and call stacks that involve libc calls.
On Ubuntu, you can install this with:
sudo apt-get install libc6-prof
libc6-prof can be used with LD_LIBRARY_PATH=/lib/libc6-prof/x86_64-linux-gnu
It may also be useful to have access to kernel addresses during profiling. These can be exposed with:
sudo sh -c "echo 0 > /proc/sys/kernel/kptr_restrict"
The max stack depth is 127 by default. This is often too few. It can be increased with:
sudo sh -c "echo 4000 > /proc/sys/kernel/perf_event_max_stack"