Reporting a Performance Problem
This article will guide you in reporting a performance problem using the built-in Gecko Profiler tool.
Using the Profiler
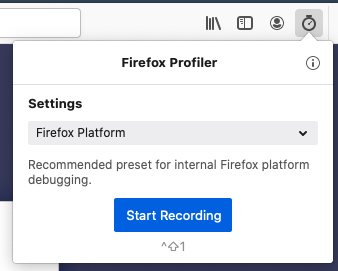
When enabled, the profiler toolbar button is not recording by default. Recording can be done by clicking on the toolbar icon to open its panel. Make sure to choose an appropriate setting for the recording (if you’re not sure, choose Firefox Platform), and then choosing Start Recording. The toolbar icon turns blue when it is recording.
The profiler uses a fixed size buffer to store sample data. When it runs out of space in its buffer, it discards old entries so you may want to increase the buffer size if you find you are unable to capture the profile quickly enough after you notice a performance problem. If you choose Custom Settings (and then clicking Edit Settings) for the profiler, you can adjust the size of the buffer (presently defaults to 90 MB) and the time interval between data collection (presently defaults to 1 ms). Note that increasing the buffer size uses more memory and can make capturing a profile take longer.

Using the keyboard shortcuts is often more convenient than using the mouse to interact with the UI:
Ctrl+Shift+1 - Start/Stop the profiler
Ctrl+Shift+2 - Take a profile and launch the viewer to view it
Capturing and sharing a profile
While the profiler is recording, reproduce the performance problem. If possible let the problem manifest itself for 5-10 seconds.
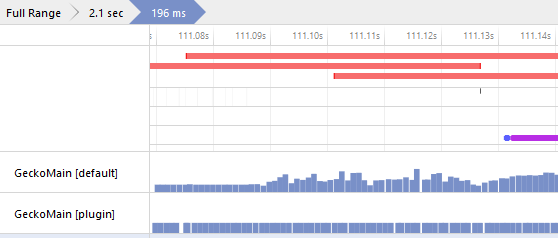
Press Ctrl+Shift+2 or click on the profiler toolbar icon in the top right and select Capture. Try to do this within a few seconds from reproducing the performance problem as only the last few seconds are recorded. If the timeline has a large red block it’s a good sign.

The data will open in a new tab. Wait until the “Symbolicating call stacks” notification disappears before sharing the profile.
There will be a button in the top right labeled Upload Local Profile which will allow you to upload this profile and once completed will write out a link. Before uploading, the Upload button asks you what data you’d like to publish to our servers.
Note that while it’s possible to strip profiles of potentially privacy sensitive information, the less information a profile contains, the harder it is to analyze and turn into actionable data.
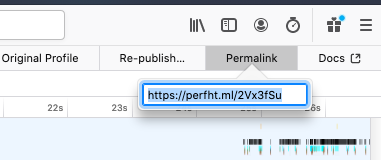
Once uploaded, copy permalink URL to your clipboard by right clicking and add the profile URL to a bug for your performance problem and/or send it to the appropriate person. Try to give some context about what you were doing when the performance problem arose such as the URL you were viewing and what actions were you doing (ex. scrolling on gmail.com).

Viewing addon performance in GeckoView
Sometimes an addon or more are slowing down Firefox. These addons might be using the extension API in ways that were not meant to. You can see which of these addons are causing problems by adding the moz-extension filter.

Make sure you are selecting the process that is using up the CPU since all of the processes are shown. You might have a content process using up the CPU and not the main one.
Make sure you are doing whatever it is that slows down Firefox while recording the profile. For example you might have one addon that slows down page load and another one that slows down tab switch.
Your first reflex once you find what addon is slowing down the profile might be to disable it and search for alternatives. Before you do this, please share the performance profile with the addon authors through a bug report. Gecko profiler allows you to share a link with the profile.
