Performance Testing in a Nutshell
Note
This page is still under construction, and is missing the videos.
This document provides all the information needed regarding the basics of performance testing our products. A set of videos, and instructions can be found to guide you across the various subjects related to performance testing. If you’re new to performance testing, starting from the first section would be the most helpful for you.
Help! I have a regression. What do I do?
Most people will first be introduced to performance testing at Mozilla through a bug like this:
The title of the bug will include the tests, and subtests that caused the largest change, the platform(s) the changes were detected on, and the date. It will also be prefixed with a range of the size (in percentage) of the changes. In the bug details, the bug which triggered the alert will also be found in the Regressed by field, and there will be a needinfo for the patch author.
Bug overview and the first comment (aka comment 0):
An alert summary table will always be found in the first comment (comment 0) of a performance regression bug, it provides all the information required to understand what regressed.
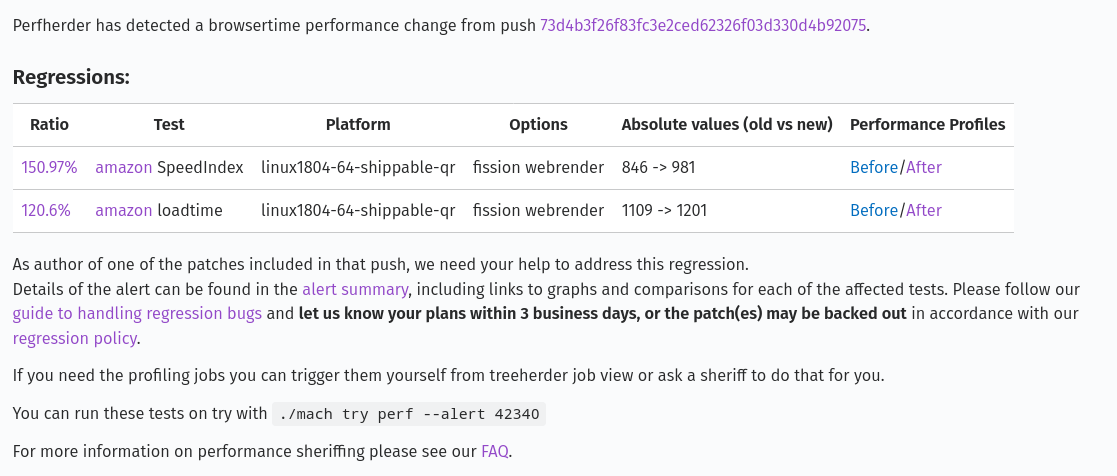
In the first sentence of the alert, a link to the actual push/commit that caused it is provided.
Below that, a table that summarizes the regressions, and improvements is shown.
Each row in the table represents a detected regression or improvement.
Ratio: Provides the size of the change, and links to a graph for the metric.
Test: The name of the test, and metric that changed. It links to the documentation for the test.
Platform: The name of the platform that the change was detected on.
Options: Specify the conditions in which the test was run (e.g. cold, warm, bytecode-cached).
Absolute Values: The absolute values of the change.
Performance Profiles: Before, and after Gecko profiles of the test (this is not available for all test frameworks yet).Below the table, an
alert summarylink can be found which provides a different view of this table, a full in-depth explanation of the alert summary link can be found here Perfherder Alerts View. Some additional debugging information such asside-by-sidevideos can be found here. It will also include any additional tests that triggered alerts after this bug was filed.Then some information on what we expect from the patch author is provided regarding how long they have to respond to the alert before it gets backed out along with links to the guidelines for handling regressions.
Finally, a helpful command to run these tests on try is provided using
./mach try perf --alert <ALERT-NUM>. See here for more information about mach try perf.
- From the alert summary comment, there are multiple things that could be verified:
Check the graphs to ensure that the regression/improvements are very visible.
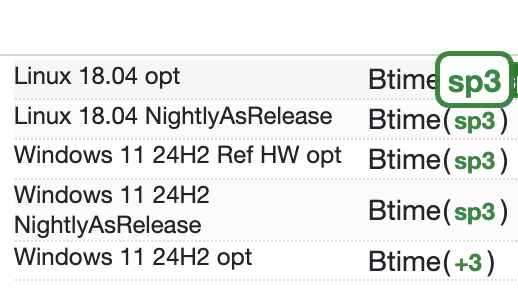
Look at the alert summary to see if there are any available side-by-side videos to visualize.
Check the test description to see what the test is doing, as well as what the metrics that changed are measuring.
Compare the before/after performance profiles to see what might have changed. See the section on Using the Firefox Profiler for more information on this.
With all of the information found from those, there are two main things that can be done. The first is investigating the profiles (or using some other tools), and finding an issue that needs to be fixed. During the process of investigating and verifying the fix, it will become necessary to verify the fix by running the test. Proceed to the Running Performance Tests section for information about this, and then the Performance Comparisons section for help with doing performance comparisons in CI which is needed for verifying if a fix will resolve the alert.
The second is requesting a confirmation from the performance sheriff that the patch which caused the alert is definitely the correct one. This can happen when the metric is very noisy, and the change is small (in the area of 2-3%, our threshold of detection). The sheriff will conduct more retriggers on the test, and may ask some clarifying questions about the patch.
If there are any questions about the alert, or additional help is needed with debugging the alert feel free to needinfo the performance sheriff that reported the bug. The performance sheriff most suitable for adding a needinfo to can be identified in comment zero of the bug.
Alert Resolution
- There are 4 main resolutions for these alert bugs which depend on what you find in your investigations:
A
WONTFIXresolution which implies that a change was detected, but it won’t be fixed. It’s possible to have this resolution on a bug which produces regressions, but the improvements outweigh those regressions.A
WORKSFORMEresolution which implies that a detection was valid, but there was no actual change to the product’s performance. Harness-related changes are often resolved this way as well since we consider them baseline changes and do not change the performance characteristics of the product.An
INVALIDresolution which implies that the detection was invalid, and there wasn’t a change to performance metrics. These are generally rare, as performance sheriffs tend to invalidate the alerts before a bug is produced, and tend to be related to infrastructure changes or very noisy tests where a culprit can’t be determined accurately.A
FIXEDresolution which implies that a change was detected, and a fix was made to resolve it.
If it’s unclear when an alert may be resolved, it’s recommended to file a follow-up bug, and close the alert as INCOMPLETE. If this cannot be done, then it’s strongly recommended to reach out to the performance sheriff.
Alert Monitoring, and the Regression Policy
There is a bugbot rule that monitors the activity of performance alerts. After 1 week of inactivity in the bug, a needinfo will be made for the regressor author to provide an update on any progress. This also notifies performance sheriffs.
If an alert is flagged in one of these notifications, and performance sheriffs find that there has been absolutely no activity on the alert since it was filed, then it will become a candidate for a backout in accordance with our regression policy. Otherwise, if there has been some activity, we will simply request an update on any progress that has been made.
- The full process for performance sheriffs who handle these notifications proceeds as follows (more detailed information can be found here):
A daily email of alert bugs with no activity is obtained.
We check if the developer (regressor author) has previously responded to the bug.
If they have responded in the past, we reach out to ask them to provide an update on the progress that has been made.
If they have not responded in the past, we reach out to ask them to provide an update and mention that the regressor patch has been added as a candidate for backout due to lack of activity.
If the developer is not responding in either of these cases, after 24 hours, we reach out to their manager with similar messages.
If the patch is a candidate for backout, and neither the regressor author or their manager responds after 24 hours, we will request a backout of the regressor patch.
Closing the bug with an Alert Resolution would be the ideal way to get the Bugbot to stop setting needinfos. Otherwise, it expects some activity there on a weekly basis if it’s being actively investigated. If the alert should be investigated some day, it could be closed as INCOMPLETE with a follow-up bug. There’s also a keyword you can add if you absolutely want to keep it open though. The keyword is backlog-deferred but please only use it sparingly otherwise these kinds of bugs often end up sitting around for years and then get closed when they can no longer be reproduced in our CI (due to machine, test, platform changes).
Perfherder Alerts View
When you click on the “Alerts Summary” hyperlink it will take you to an alert summary table on Perfherder which looks like the following screenshot:

The table has 1 performance metric per row that has either improved or regressed a metric.
From left to right, the columns and icons you need to be concerned about as a developer are:
Graph icon: Takes you to a graph that shows the history of the metric.
Test: A hyperlink to all the test settings, test owner, and their contact information. As well as the name of the subtest (in our case SpeedIndex, and loadtime).
Platform: Platform of metric which regressed.
Debug Tools: Tools available to help visualize and debug regressions.
Information: Historical data distribution (multimodal data, ok, or n/a if not enough information is available).
Tags & Options: Specify the conditions in which the test was run (e.g. cold, warm, bytecode-cached).
Magnitude of Change: How much the metric improved or regressed (green colour indicates an improvement and red indicates a regression).
Confidence: Confidence value of metric (number is not out of 100) higher number means higher confidence.
Running Performance Tests
Performance tests can either be run locally, or in CI using try runs. In general, it’s recommended to use try runs to verify the performance changes your patch produces (if any). This is because the hardware that we run tests on may not have the same characteristics as local machines so local testing may not always produce the same performance differences. Using try runs also allows you to use our performance comparison tooling such as Compare View and PerfCompare. See the Performance Comparisons section for more information on that.
It’s still possible that a local test can reproduce a change found in CI though, but it’s not guaranteed. To run a test locally, refer to the harness documentation test lists, such as this one for Raptor tests. There are four main ways that you’ll find to run these tests:
./mach raptorfor Raptor
./mach talos-testfor Talos
./mach perftestfor Mozperftest
./mach awsyfor AWSY
It’s also possible to run all the alerting tests using ./mach perftest. To do this, find the alert summary ID/number, then use it in the following command:
./mach perftest <ALERT-NUMBER>
To run the exact same commands as what is run in CI, add the --alert-exact option. The test(s) to run can also be specified by using the --alert-tests option.
Performance Comparisons
Comparing performance metrics across multiple try runs is an important step in the performance testing process. It’s used to ensure that changes don’t regress our metrics, to determine if a performance improvement is produced from a patch, and among other things, used to verify that a fix resolves a performance alert.
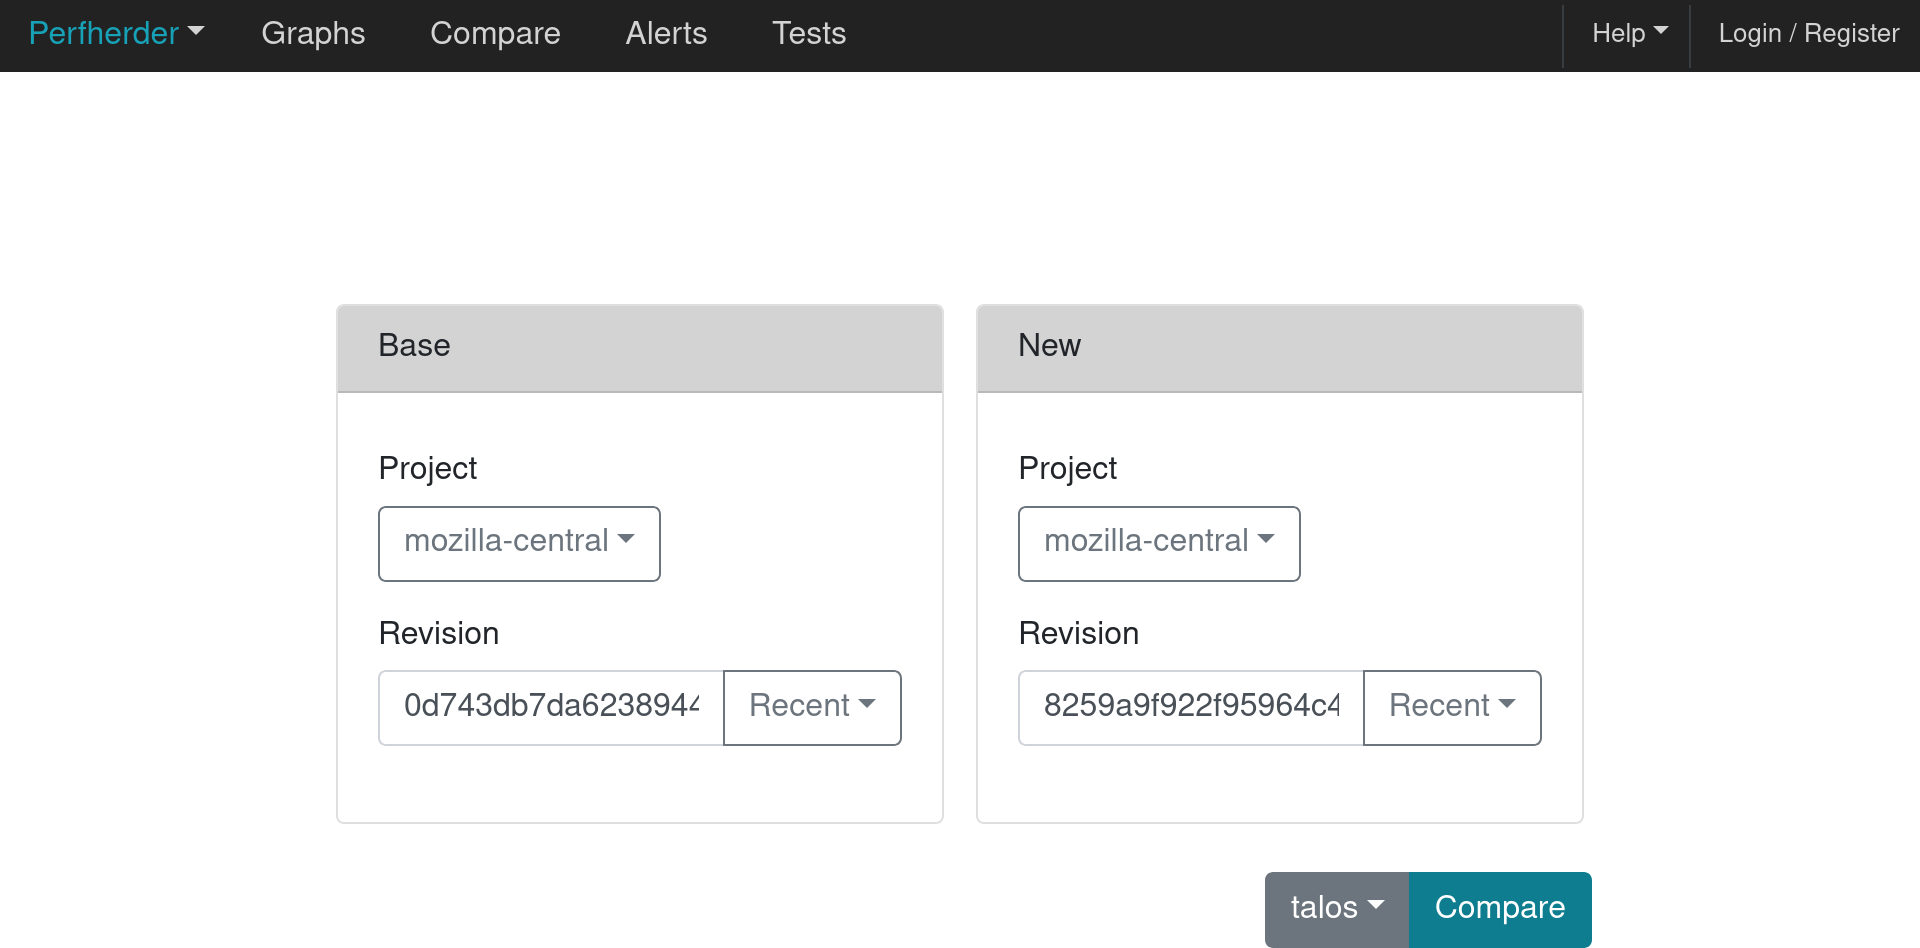
We currently use PerfCompare for comparing performance numbers. Landing on PerfCompare, two search comparison workflows are available: Compare with a base or Compare over time. Compare with a base allows up to three new revisions to compare against a base revision. Although talos is set at the default, any other testing framework or harness can also be selected before clicking the Compare button. You can find more information about using PerfCompare here.
Our old tool for comparing performance numbers, Compare View, will be replaced by PerfCompare early next year. The first interface that’s seen in that process is the following which is used to select two pushes (based on the revisions) to compare.
At the same time, the framework to compare will need to be selected. By default, the Talos framework is selected, but this can be changed after the Compare button is pressed.
After the compare button is pressed, a visualization of the comparisons is shown. More information on what the various columns in the comparison mean can be found in this documentation.
Using the Firefox Profiler
The Firefox Profiler can be used to help with debugging performance issues in your code. See here for documentation on how it can be used to better understand where the regressing code is, and what might be causing the regression. Profiles are provided on most alert summary bugs from before, and after the regression (see first section above).
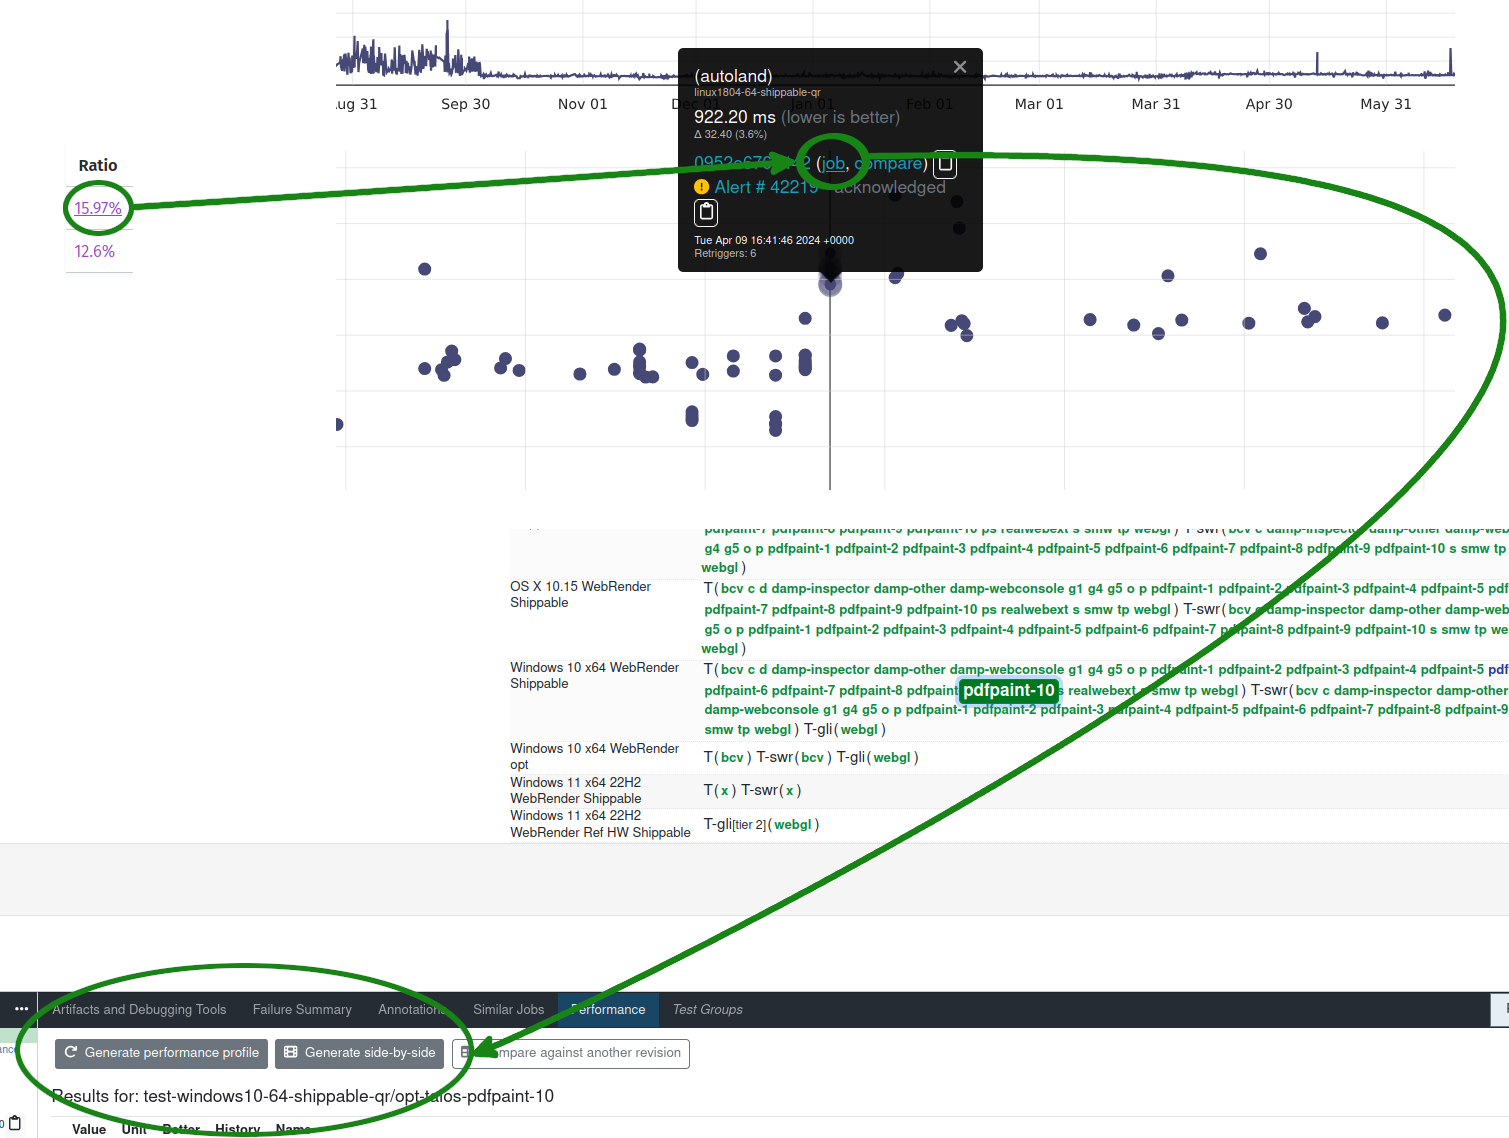
If those are not provided in the alert summary, they can always be generated for a test by clicking on the graphs link (the percent-change ratio in an alert summary), selecting a dot in the graph from before or after a change, and clicking the job link. Then, once the job panel opens up in Treeherder, select Generate performance profile to start a new task that produces a performance profile. See the following graphic illustrating this process:
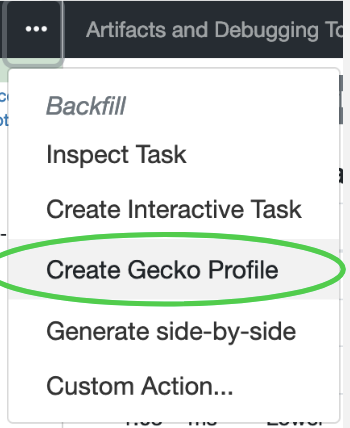
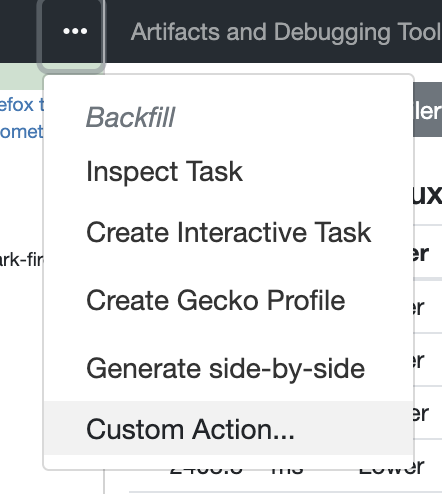
Additionally, you can also use the overflow menu and generate a profile:
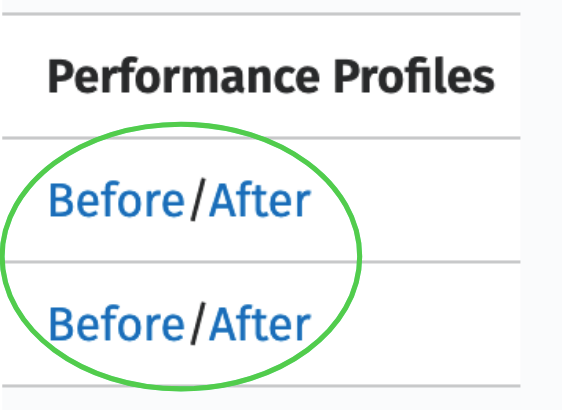
Most Raptor/Browsertime tests produce a performance profile by default at the end of their test run, but Talos, MozPerftest, and AWSY tests do not. As previously mentioned, for regression/improvement alerts, you can find a before and after link of these profiles in Comment 0:
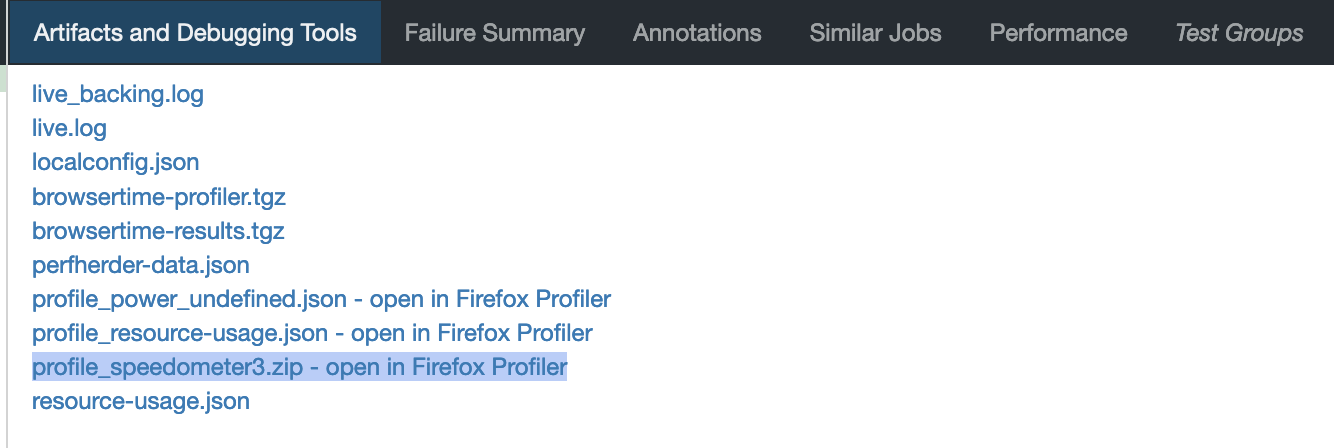
You can also find the profiles in the artifacts tab of the Raptor test:
To generate the profiles locally, you can pass the flags --extra-profiler-run or --gecko-profile which repeat the test for an extra iteration with the profiler enabled, or run the test from the beginning with the profiler enabled for three iterations, respectively. It’s also possible to specify more configuration such as the profiled threads, the sampling interval or the profiler features being enabled. The parameters used in a profiling run can be copied directly from the about:profiling page in any Nightly build: click the button at the top of the page, then pick the option “Copy parameters for performance tests”.
Triggering Gecko Profiles in CI with Custom Parameters
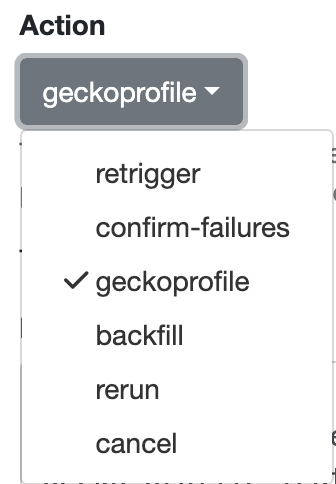
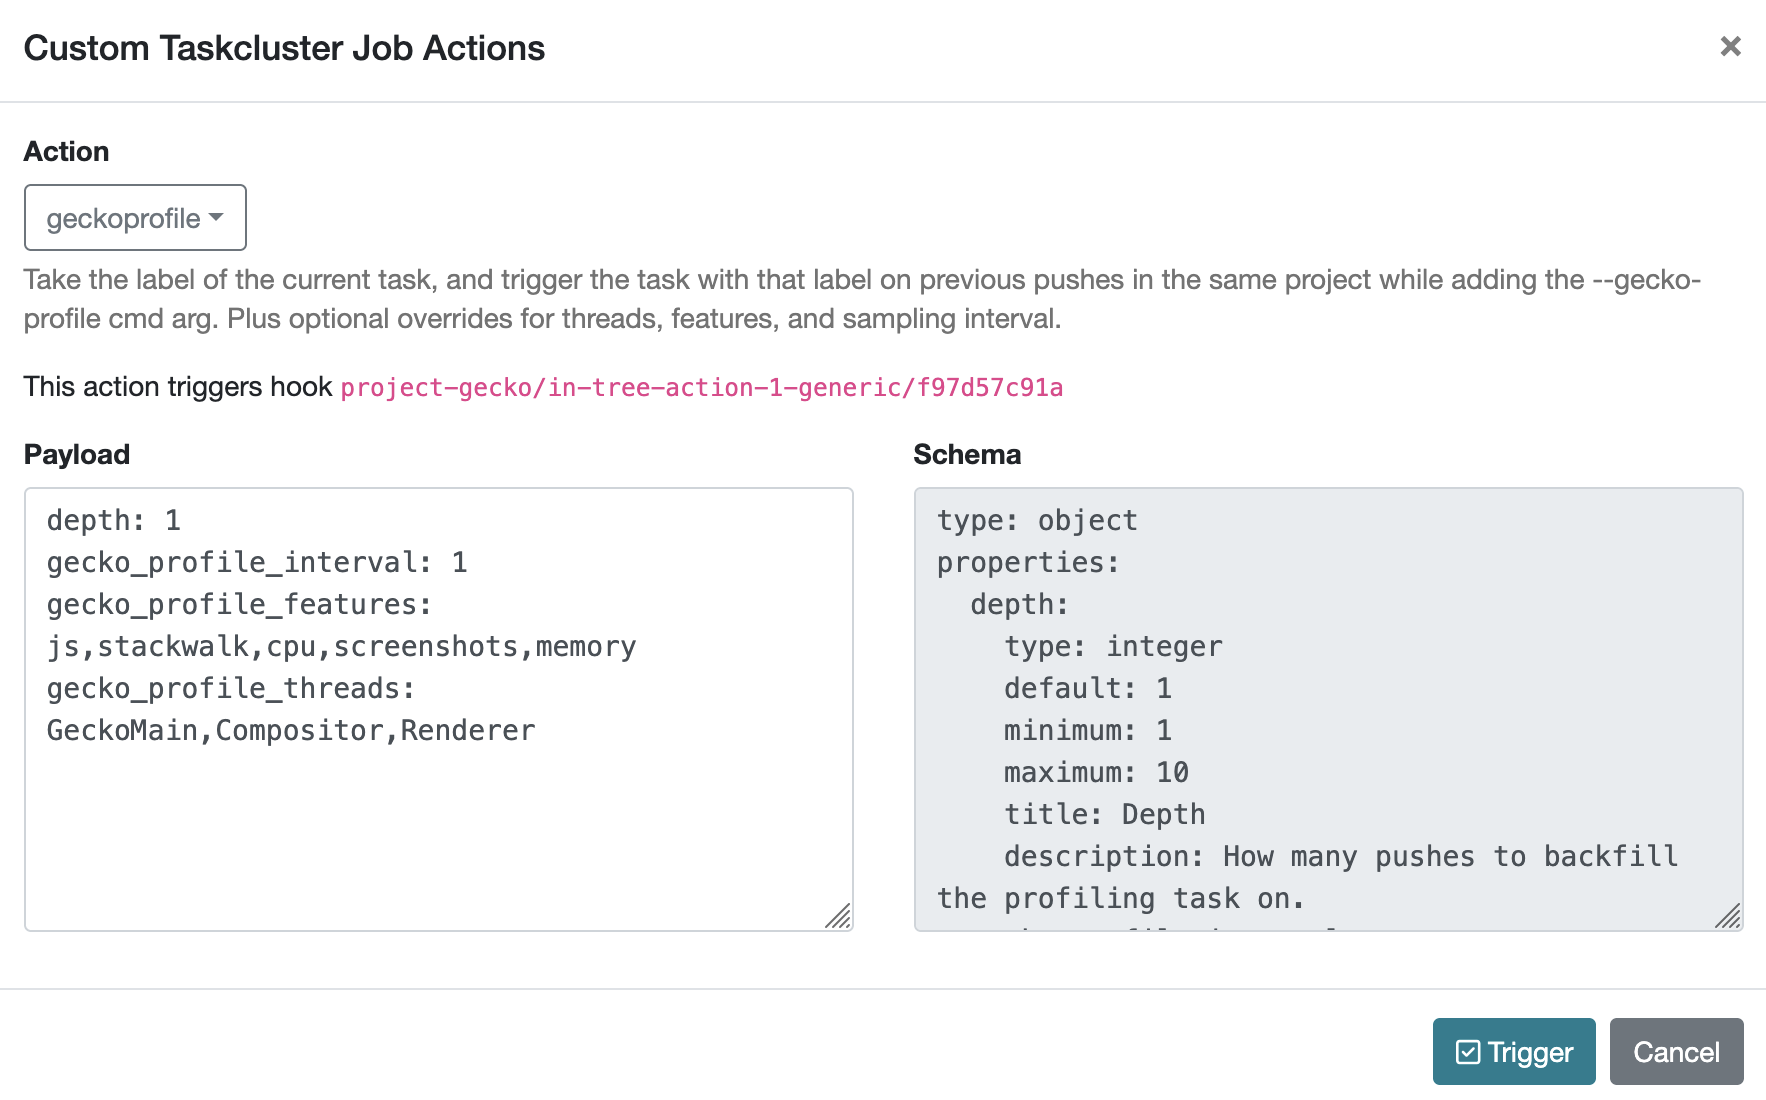
In addition to using creating a Gecko Profile with the treeherder actions, you can also generate a Gecko Profiler run with custom options directly in CI using the geckoprofile Treeherder action after navigating to Custom Action.
This is useful when you want to profile an existing task using custom profiler settings such as specific threads, sampling intervals, or features, without needing to submit a new try push with non-default parameters.
How to trigger a custom Gecko Profile
Go to the push in Treeherder that ran the test you’re interested in.
Click on the task (e.g. a Raptor or Talos test).
In the task detail panel, click the three-dot menu and select
Custom Action.
From the list of actions, choose
geckoprofile.
Fill in the profiling parameters:
gecko_profile_interval– sampling interval in milliseconds (e.g. 1)gecko_profile_features– comma-separated feature list (e.g. js,stackwalk,cpu,screenshots,memory)gecko_profile_threads– comma-separated thread names (e.g. GeckoMain,Compositor,Renderer)
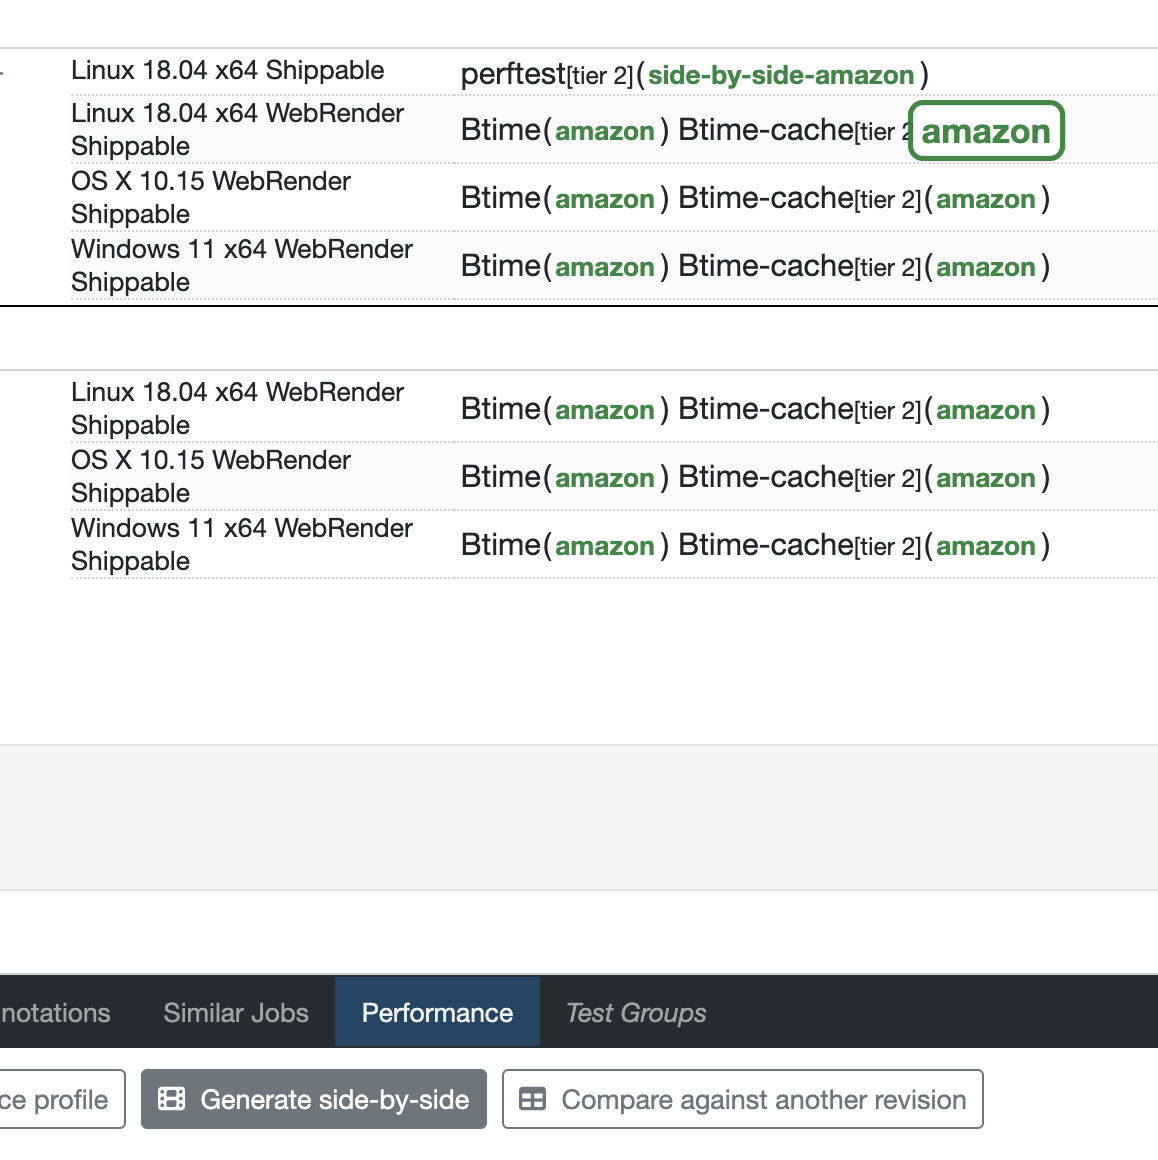
Side-by-Side
Side-by-Side is a job that compares the visual metrics provided by Browsertime for two consecutive pushes. This job is only applicable to pageload-type jobs, and both revisions must run on the same platform with identical configuration.
Generate a Side-by-Side Job
To generate a side-by-side job, follow these steps:
Once the process is initiated, a new job will appear in the format side-by-side-*job-name*.
Viewing Results
Once the newly generated job is complete, you can view the result by selecting the job. This type of job provides two types of video (cold and warm). For each set, there are 2 viewing modes (normal and slow-motion).
Each video includes an annotated description containing the visual metrics provided by Browsertime.
Adding Performance Tests
This section is under construction.
Additional Help
Reach out to the Performance Testing, and Tooling team in the #perftest channel on Matrix, or the #perf-help channel on Slack.


