Debugging Firefox with Pernosco
This page is intended to help Firefox/Gecko developers get started using Pernosco to debug Firefox.
Mozilla employees have a paid subscription to Pernosco, and are encouraged to use it. Contributors can use Pernosco as well. A free account comes with 5 uploads to see if it is suitable for your workflow.
Prerequisites
You need the ability to produce an
rrtrace. See Debugging Firefox with rrEmployees, you can also generate traces for Pernosco for some CI job failures via Treeherder.
Workflow
At a high level, working with Pernosco consists of recording a trace then uploading the trace for processing.
Install your Pernosco configuration
If you are using your own Pernoso account, follow the instructions here to install your credentials.
Mozilla employees, see the Pernosco install and configuration doc for credentials.
In general, you will want:
Your email in
~/.config/pernosco/userYour group in
~/.config/pernosco/groupYour key in
~/.config/pernosco/user_secret_key
Gather a Local Trace
In general, to gather a trace follow the instruction for recording rr traces
in Debugging Firefox with rr. However, to gather a local rr trace that’s
compatible with Pernosco you need to disable some incompatible CPU features (currently
only AVX-512)
On an Intel machine, you can disable this at the command line. To simplify things a
shell script pernosco-record can be created like so,
#!/bin/bash

rr record --disable-avx-512 "$@"
replacing plain rr in command lines (mach --debugger pernosco-record)
On AMD Zen Machines, you can disable AVX-512 and 5 level page tables at boot.
On a Debian derived distro this involves editing /etc/default/grub and
adding clearcpuid=304,no5lvl to GRUB_CMDLINE_LINUX_DEFAULT, then
running sudo update-grub after.
Upload the trace
Find the trace you’re interested in ~/.local/share/rr/<trace>, and call pernosco-submit
pernosco-submit upload ~/.local/share/rr/<trace> PATH_TO_CENTRAL --title "Name Of Trace"
where PATH TO CENTRAL is the path to the source of your build, checked out
to the revision matching the build.
The last trace recorded is always symlinked, so you can use ~/.local/share/rr/latest-trace too.
Wait for email
After the trace is processed, you’ll get an email with a link to your trace. Good hunting!
Treeherder Workflow
You can also try to get traces generated via the Treeherder interface. On a failing test that is eligible, in “Artifacts and Debugging Tools”, you’ll see a link to
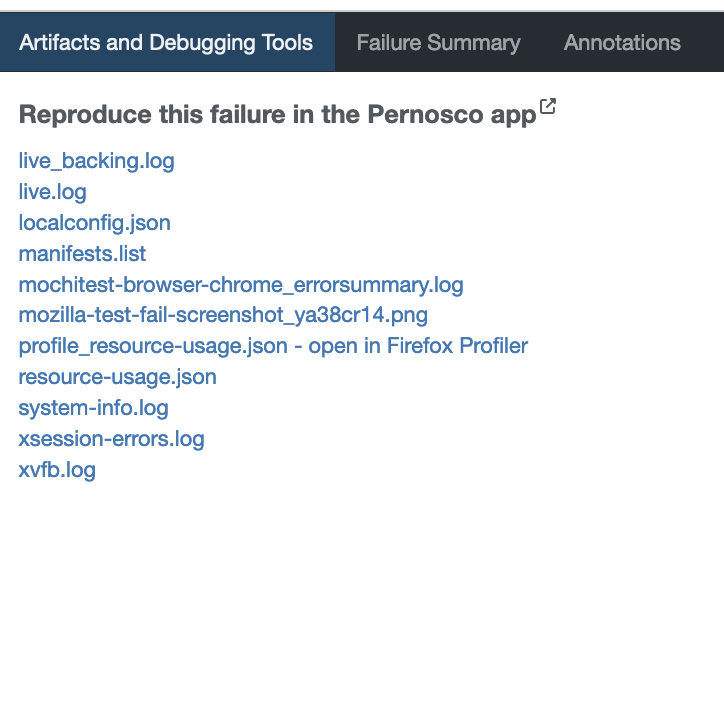
This link brings you to the self-service reproducer:
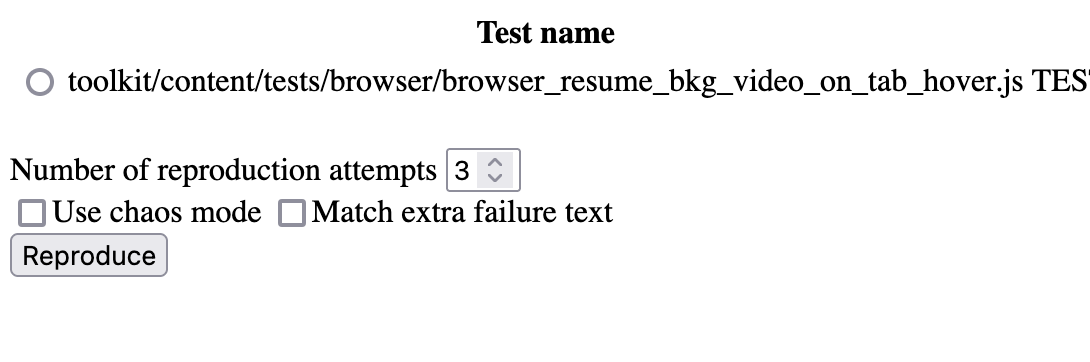
Select a test and a count, and whether or not chaos-mode should be used, then click
reproduce. At this point there is a long wait; the page will notify you when
reproduction has started with an alert dialog.